As an early beta tester of Amazon’s new Brand Analytics tool, I had the opportunity to use it for a couple of months before it went live in early August. These new reports have quickly become some of my favorites.
Amazon Search Terms
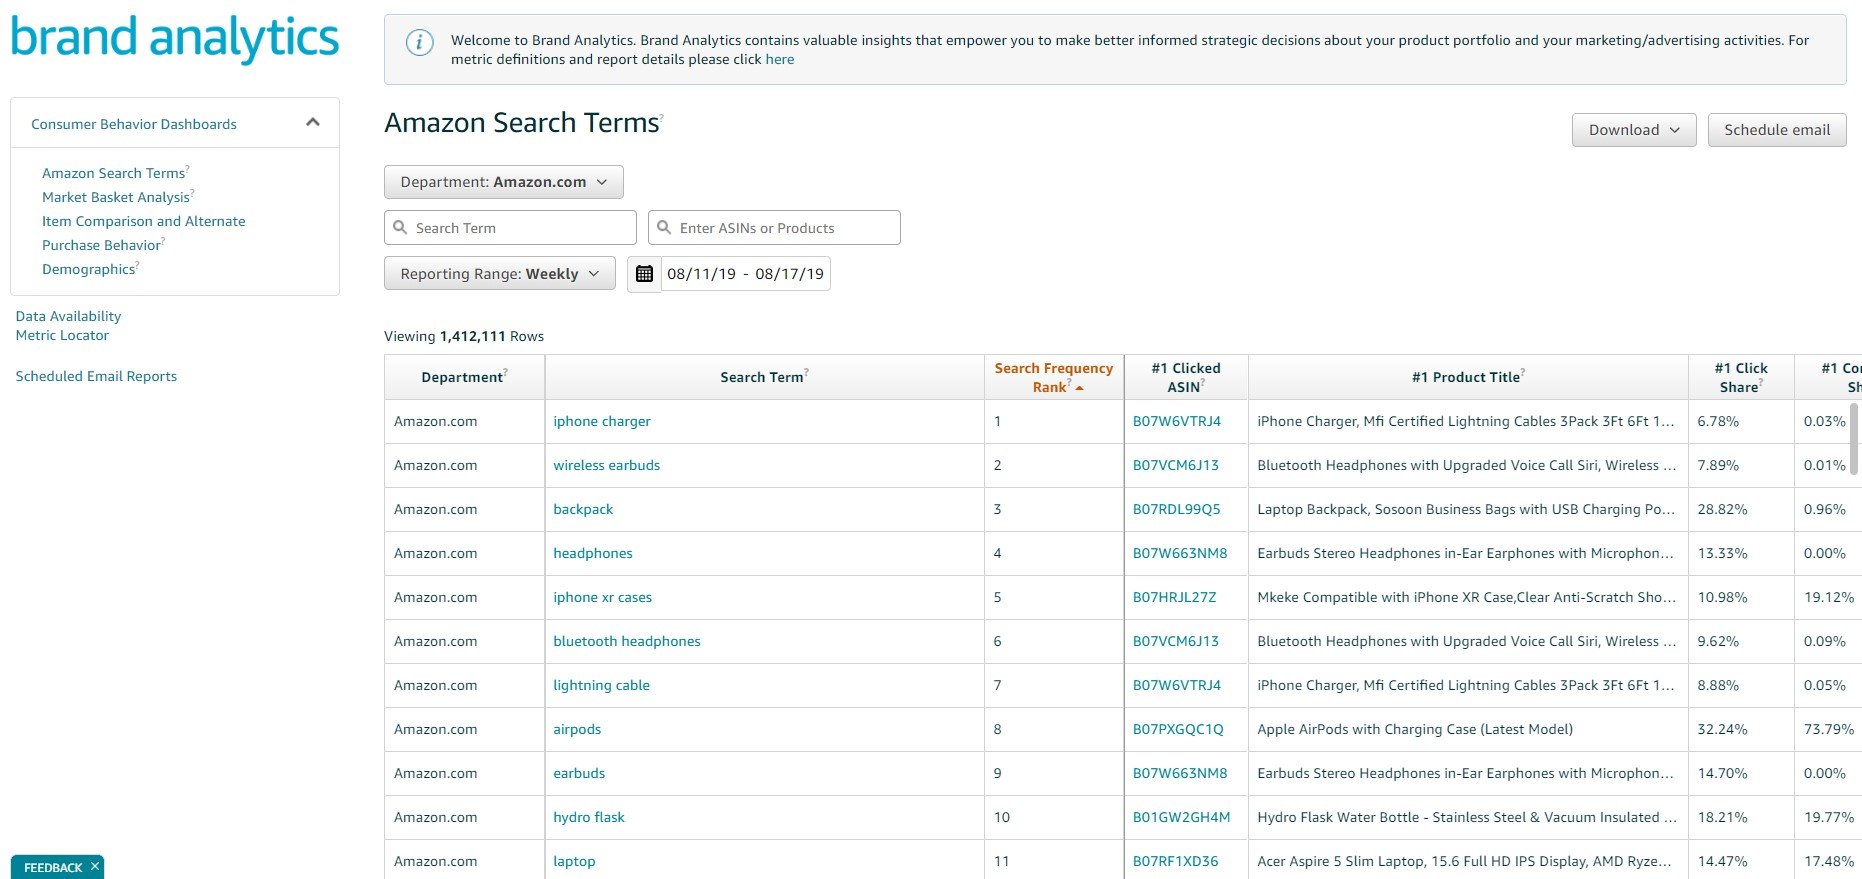
The default view when clicking into the Brand Analytics tool, the Amazon Search Terms report identifies the top search terms that shoppers use on Amazon. It is great as a benchmarking tool. I use it to see where products rank on the most important search terms, to help plan organic and paid efforts to increase visibility.
It helps determine how Amazon shoppers search for products. What many sellers think are their top terms suddenly changes after analyzing this report.
I am asked all the time, “How can I see what my competition is doing?” With this report, that answer is slightly easier. By singling out the top three Amazon Standard Identification Numbers (ASINs) that rank for a keyword, Amazon has effectively painted a red target on those top three products.

While this data may prove beneficial for sellers to get competitive insights, be careful what you wish for. The target will be on you when you’re ranking in the top spots.
To use the Amazon Search Terms report, simply select the department that you’d like to search within, enter your target search term or product ASIN, and select a timeframe. Right now, the only timeframes available are daily, weekly, monthly, or quarterly. You can’t specify custom date ranges.
Once you’ve entered that information, you’ll see the following columns:
- Department: The Amazon department you searched within.
- Search Term: The customer search terms entered into Amazon that relate to your target search term or ASIN.
- Search Frequency Rank: How often a particular term is searched within the reporting range. The lower the number, the more searches happen on that term. Frequency is dependent upon the department you searched within. If you don’t select a department, the frequency is compared against all terms searched in all departments on Amazon.
- #1 Clicked ASIN: The ASIN that received the most clicks for that search term during the reporting range.
- #1 Product Title: The title of the number-one ranked ASIN.
- #1 Click Share: The percentage of clicks that the number-one ranked ASIN received, in comparison to the total number of clicks, based on the search results that occurred within that department and reporting date range.
- #1 Conversion Share: The percentage of the conversions that the number-one ranked ASIN received, in comparison to the total number of conversions, based on the number of searches in that department during the selected timeframe.
The remaining columns show the same information as above for the second- and third-ranked ASINs. Be prepared to scroll to the left!
The results of the report can be downloaded into an Excel workbook or a CSV file. Another neat feature: You can schedule this report – with a view of all of the data – to be sent via email on a monthly basis.
Market Basket Analysis
This report shows the top three products that are purchased at the same time as your brand’s products. The “#1 Combination Percentage” column features the percentage of times each of those top three products was purchased with the brand owner’s products, in comparison to all products that were purchased with the brand product during the set reporting date range.
I use the Market Basket Analysis to easily identify cross-selling or bundling opportunities, though the value of the report does vary. Some brands have a variety of other brand purchases connected to their products, while others are strictly within brand.
Noticing this shopping behavior can also help a brand gauge Amazon shoppers’ tendency to add additional items to an order for their particular product category. Some categories lend themselves to cross selling and bundling better than others. Not only can this report show where that’s possible, but also where that strategy may hit a wall.
As with the search terms report, there are multiple filters that can be applied to the data view, including:
- Categories: The categories your brand’s products are listed in, or connected to, as well as the applicable subcategories.
- Brands: If you have multiple brands, you can filter by brand as well to isolate this data.
- Date Range: The reporting timeframe is selectable as well, with daily, weekly, monthly, and quarterly options.
- Display: View only your brand’s products, exclude your brand’s products, or view all products. This allows you to see what top three brand products are purchased with your target brand product, or to see what non-brand products are purchased.
Item Comparison and Alternate Purchase Behavior
The first table in this report is the Item Comparison report. It shows the five products that Amazon shoppers most frequently viewed during the same day as your brand products. This gives you a competitive view of other products, both inside and outside your brand category space. In addition, it shows the percentage of times each of those five products was viewed in comparison to your brand’s product.
Just as with the previous two reports, there are a variety of filters for the data: category, subcategory, brand, and reporting date range.
Below the Item Comparison table is the Alternate Purchase Table. This report shows the top five products a shopper most frequently purchased instead of yours on the day your product was viewed. The percentage of time each of those five products was purchased instead of yours is also included.
After the Amazon Search Term report, this may prove to be the most valuable report released, though the usefulness does vary depending upon your brand and category. I find that the broader a category is, the wider the range of item comparison and alternate purchased products data outside of your brand will be.
For niche brands, I see more item comparison and alternate purchases data within brand. This is especially true for brands that variate their products. When viewing the report for a child SKU within a parent variation, most of the comparison and alternative purchases happen within brand.
Using the Item Comparison and Alternative Purchase Behavior reports in combination can give you an idea of how well your product content and advertising efforts are working to keep Amazon shoppers within brand.
If you are seeing a lot of shopping around on your products, or purchases of competitors’ products, it’s worth looking at your content to be sure all your key value statements are as strong as they can be.
Compare your product listing to the product that shoppers are purchasing instead. How is their content different from yours? Do they have better value statements, or do they highlight product features in a different way?
Demographics
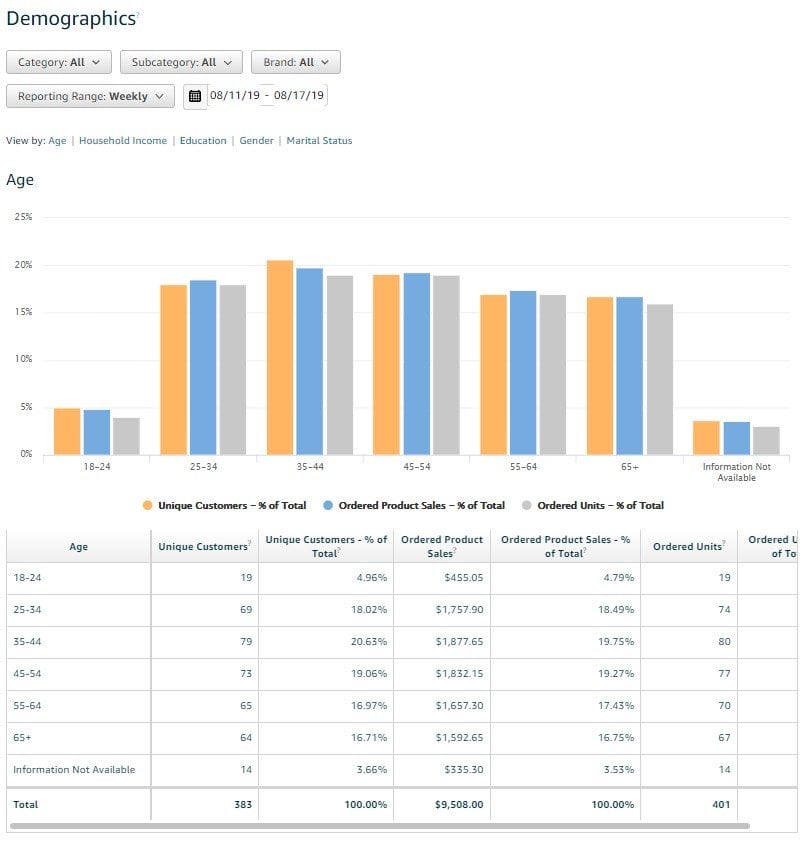
Amazon has traditionally only made demographic data available to those vendors who invested in Amazon Retail Analytics (ARA) Premium. Now, basic demographic data is available to all brand owners in Seller Central, including age, household income, education, gender, and marital status.
The data is an aggregate breakdown of sales for all of a brand’s ASINs. It is not possible to break this data down at the product level, but it can be filtered by the same parameters as most of the other previous reports: category, subcategory, brand and reporting date range.
Brand owners now have a clearer picture of who is purchasing their products. So far, I’m finding that some accounts show most of the data in the far right “Information Not Available” column. However, what data is available is still very valuable. You can build Amazon buyer personas based on the data available, as well as use the data to curate copy, imaging, and advertising messaging.
While you can’t yet target advertising efforts by demographics in the Amazon platform, this level of ad targeting may be closer than we think.