Google Looker Studio is a useful data reporting sandbox you can use to connect to Google Ads and present data in new and interesting ways. It can be an effective way to present data in ad hoc formats that are impactful to your clients’ or stakeholders’ unique needs.
Data presentation matters to most, if not all, clients, whether those clients are external or internal to your company. Copying and pasting tables from Excel into an email to answer a question gets the job done, but in less time, you can present that same data in a way that feels more polished and visually engaging.
This article covers three Google Looker Studio tips and tricks you can use to make sure your reports leave a strong impression.
Tip 1: Match your reports to your brand aesthetic
I do the bulk of our client audits, and I’ve had multiple people tell me they appreciate that my Looker Studio reports match their company’s colors. In Looker Studio, pretty much every aspect of your report can use custom colors, from tables to charts to fonts. To match your color scheme exactly, visit the website and use a color dropper Chrome extension to grab the correct hex codes (I usually limit it to the top two or three colors). Copy and paste your hex codes (i.e., #ecf3fe) and either edit individual components within your report or update the theme colors under the “Theme and layout” section.

Tip 2: Use scorecards with sparklines to present data cleanly and effectively
Use a template that you can copy and customize for individual reports. If it’s a simple, no-frills dashboard used to communicate performance to the C-suite, for example, high-level metrics are what matter most. It’s also best to present the data in a “no click needed” format so it’s not overcomplicated with buttons or controls.
For this type of report, I like to start with a high-level “scorecard” layout that highlights top metrics over a set period of time (usually last month or the last 30 days). The scorecard chart is simply a one-metric box that can report on any available metric. When you group these scorecards together, the data is presented in a way that’s simple, clean, and easy to digest.
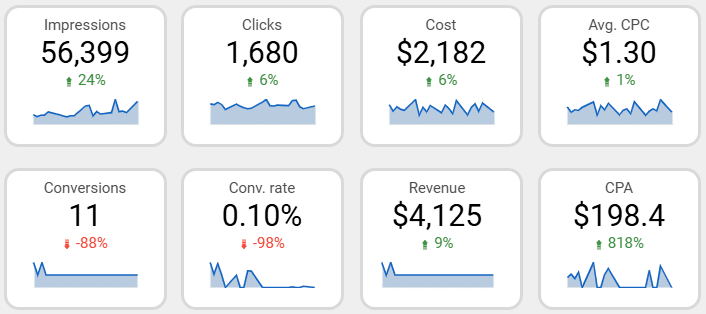
The blue line charts in the example above are called “sparklines.” To use these, add your scorecard first. Then, under the chart setup for that scorecard, look for the “Sparkline” option, and select the time dimension you’d like to use (days, weeks, months, etc.).
Tip 3: Use conditional formatting to make certain metrics stand out
If you have a standard table of data in Looker Studio, its default format doesn’t stand out much. I use conditional formatting to help highlight meaningful metrics within that table so they draw more attention than the rest.
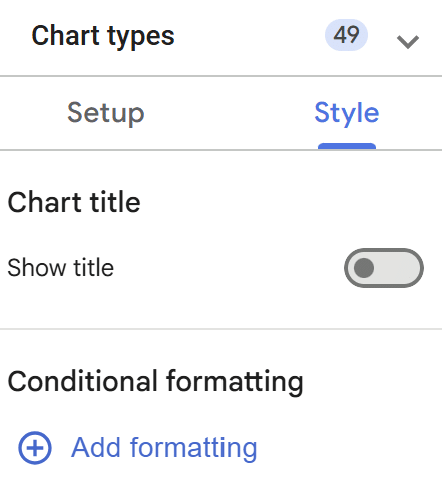
To enable conditional formatting, click into the “Style” section of your table and select “Add formatting” under the “Conditional formatting” section.
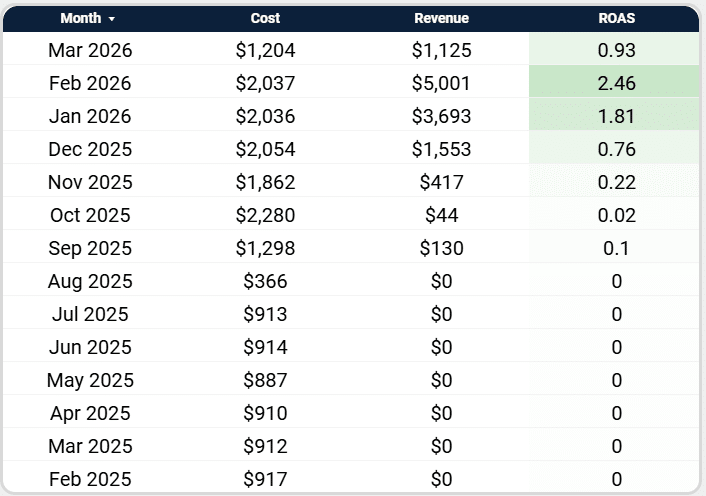
Next, choose between rules-based conditional formatting or color scale formatting (like in the example above).
Color scale formatting will apply different colors to each row of the selected dimension based on the range of values for that metric.
Why This Matters for Your Reporting
At the end of the day, most clients aren’t looking for more data; they’re looking for clarity. A well-built Looker Studio report makes it easier to understand performance at a glance and helps guide better conversations. Small adjustments like these can go a long way in making your reporting feel more thoughtful and easier to work with.