
As more and more automation makes its way into Google Ads, some things have gotten a lot easier. The introduction of responsive ads has certainly decreased the time you spend trying to create the perfect text ad. If we continue along the trend we’re on, crafting the best performing, most-efficient ad is only going to get easier and easier. Google’s new Ad Strength metric that grades how well your ad is built is a perfect example.
Ad strength isn’t relevant to all of the ads in the Google Ads universe; it’s only pertinent to Google’s new responsive ads. To fully understand how ad strength is measured, you need to know how responsive search and display ads work.
A responsive search ad is basically an expansion of the already expanded text ads (ETAs). Whereas an ETA is made up of three headlines, two description lines, two paths and a final URL, a responsive search ad can have up to 15 headlines and four description lines. Google will create hundreds of different combinations of headlines and description lines, testing which combinations perform best.
Responsive display ads are similar. They can have up to 15 images, five logos, five headlines, one long headline, and five description lines. As with responsive search ads, Google will test different combinations to determine which is most likely to lead to a conversion.

Ad strength helps you build better responsive ads, making Google’s testing more efficient and effective. It has four grades: Poor, Average, Good, and Excellent. If your responsive ad strength ranks as Average or Poor, Google will give you suggestions on how to improve it. Some of the suggestions I’ve seen are:
- Add more headlines.
- Include more keywords in headlines.
- Add more unique headlines.
The more elements you give Google to test, the better the overall performance of the responsive ad will be.
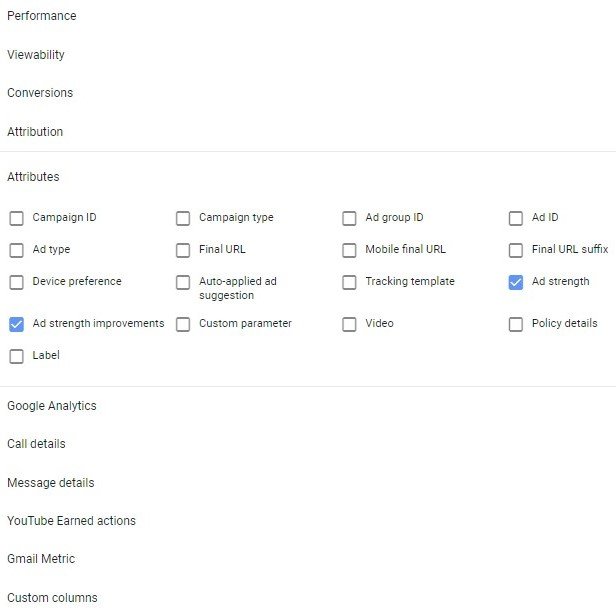
You can find both “Ad strength” and “Ad strength improvements” in the Google Ads interface. Choose the “Ads & Extensions” tab, then the “Attributes” category, as shown below.
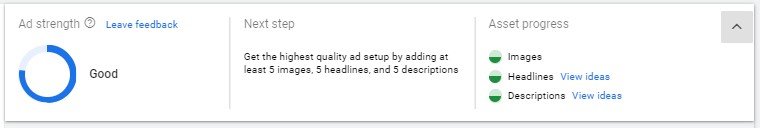
The ad strength meter, shown below, is prominent when you are building both responsive display ads and responsive search ads. Your score will change dynamically as you add more assets.
This is a good first step for Google responsive ads reporting. Hopefully, more metrics will be available in the coming months.
Currently, reporting for responsive ads is very basic. There’s still no way to truly determine for yourself which ad combinations perform the best. The only quantitative data you can see so far is how many impressions each combination has gotten, but you can’t see any click or conversion metrics. Google seems to be keeping those numbers to themselves. You can also see how Google thinks each individual asset of your responsive ad is performing, but the data is lumped into three buckets: Pending, Learning, and Good.
We’re still at the dawn of the responsive ads age, so hopefully it gets even better from here.